Monday, August 4, 2014

Visualization of Canal Cross-Section using Data Acquired from Teleoperated Boat

This work is to be presented in Asian Conference of Remote Sensing (27-31 Oct 2014).

This work is part of a research project, the objective of which is to provide its users, mainly flood management officers, a better understanding of canal or waterway profiles that allow them to develop an effective water diversion plans for flood preparedness.

This study directly continues from our recently-published work, 3D Reconstruction of Canal Profiles using Data Acquired from Teleoperated Boat, which focuses on presenting 3D image of canal profiles using laser data, depth data and geolocation data acquired from the teleoperated boat. In this work, we focus more on presenting cross-section images of the surveyed canals.

Ideally, GPS, IMU, 2D laser scanner and depth sounder should be installed on the boat at the same position, preferably the centroid of the boat. Since all of these sensors cannot share the same position due to their size, lever arm offsets must be included in the computation. Instead of using the offsets directly, we derive them by asking the users to input the positions of IMU (O_BSC), 2D laser scanner (O_LCS) and depth sounder (O_DCS) which are specified with respect to the position of GPS (O_GCS), as illustrated in the figure below.


The application to reconstruct canals in 3D and visualize the cross-sections of canals was developed in the C/C++ language. We used the OpenGL library to facilitate graphical image rendering, and used the Qt library to create graphical user interface that allows the users to interact with the application and adjust the visualization results. This section discusses the input data and the process to convert them into georeferenced 3D points. We explain the data structure and the detail of creating cross-section images. The general system architecture and the point cloud coloring method were discussed in our recent paper (Tanathong et al., 2014).

The application requires the GPS/IMU data in conjunction with either laser data and depth data. The format for each data file used in this work is presented as the below figure. Note that these three sources of data are synchronized by acquisition time.


The GPS/IMU records must be stored in an internal storage, defined as an array of GPSIMU_RECORDs, such that the application can immediately retrieve these data for drawing the trajectory line of the boat to aid the interpretation of visualized canal scenes. On the contrary, the laser and depth data are not kept as raw inputs but converted into 3D points and stored into an array of 3DPOINTs to be visualized as 3D point clouds. The data structure are presented below:


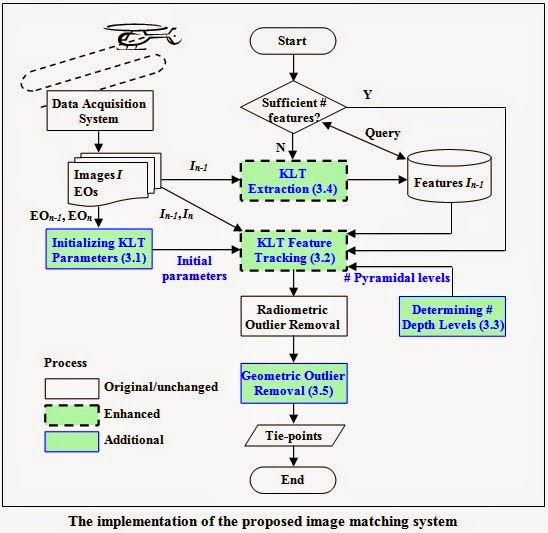
The data processing procedure is summarized as the below figure. Note that this processing procedure intuitively sorts the 3D points in the point cloud storage by the acquisition time.


Prior to talking about the visualization of canal cross-section, we have to understand the term projection and unprojection. Plotting onto the display screen the 3D points retrieved from the 3D point storage presents the image of canal profiles in 3D. Although these 3D points are said to be presented in 3D, since the display screen is flat and has only two dimensions, they, in fact, are positioned as 2D points on screen. The process that converts the 3D coordinates into their corresponding 2D positions on a flat screen is known as projection (consult Shreiner et al. (2013) for more detail), while the reversed process is unofficially referred to as unprojection.

In order to visualize a cross-section image of the canal reconstructed from the data acquired from the teleoperated boat, the users browse along the 3D canal by customizing the viewing parameters, then mark a good position by clicking on the display screen. The user-click action unprojects the 2D screen coordinate at the clicked position (xʹ,yʹ) into its corresponding 3D coordinate (X,Y,Z). Then, this 3D coordinate is used to retrieved its N neighboring 3D points stored adjacently in the array of points. These 3D points are then used to produce the cross-section image of the selected position. The procedure to visualize cross-sections is summarized as the figure below:


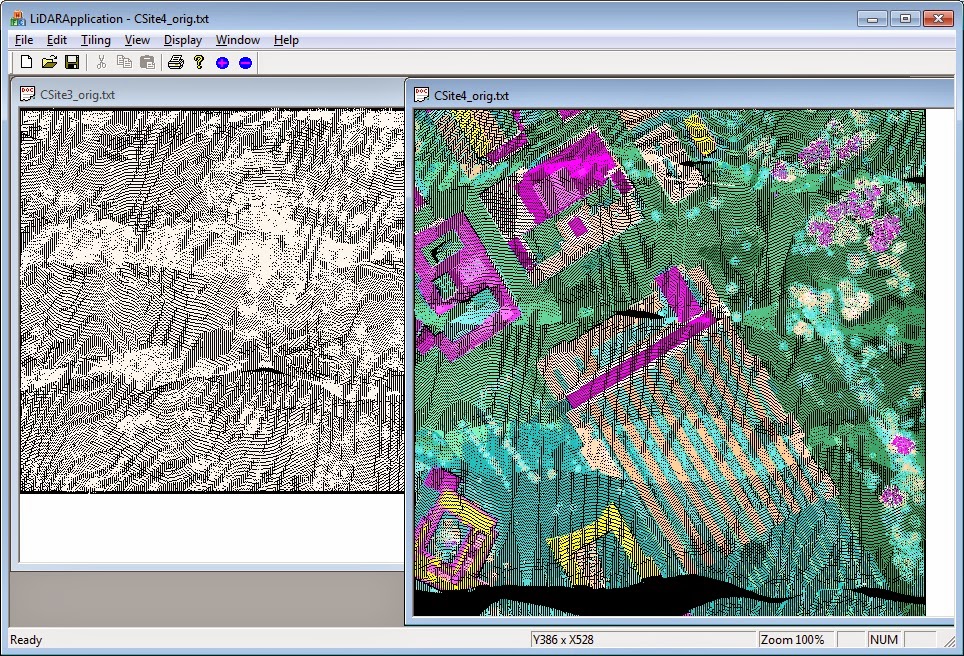
Some of the results is illustrated as the figure below:


Publications:
Tanathong, S., Rudahl, K.T., Goldin, S.E., 2014. Towards visualizing canal cross-section using data acquired from teleoperated boat. To be included in the Proceedings of Asian Conference of Remote Sensing (ACRS 2014), Nay Pyi Taw, Myanmar, 27-31 Oct 2014.

Thursday, July 3, 2014

3D Reconstruction of Canal Profiles using Data Acquired from Teleoperated Boat

Over the past three years, Thailand has experienced widespread flooding in several regions across the country. In fact, flooding has always been a recurring hazard in Thailand, but recently, due to rapid urban development and deforestation, flooding has become more severe. In order to reduce the hazard severity and minimize the area affected by flood, flood management personnel need to know the profiles of canals and waterways. The profile data should, at least, include physical descriptions of canal banks, width between two sides of canal, depth of canal bed, water level, and existing structures along the stretches of waterways. This will allow them to effectively direct the water flow in ways that can reduce the amount of flood water.

In this work, we equip a teleoperated boat with a 2D laser scanner, a single-beam depth sounder, and GPS/IMU sensors to make it possible to describe canal banks and bottom profiles during navigation along the waterway.


The 2D laser scanner documents the environment by emitting its laser pulses from the left side to the right side, which covers 270deg. The figure below illustrates the installation of the laser scanner and the moving direction.


The laser range and depth parameters while the boat documenting canal banks and the bottom profiles can be illustrated as the figure below.

Both laser scanner data and depth data are acquired in their own local coordinate systems. In order for these data to be integrated and be able to produce the picture of waterways, they must be georeferenced into the same coordinate system, principally the world coordinate system (GCS). The transformation from one coordinate system to another is basically a series of transformations, each of which is defined by an individual 3D rotation matrix, from the initial coordinate system in which the data is defined into the destination coordinate system. Here, we transform the laser coordinate system (LCS) into the boat coordinate system (BCS) then the North-East-Down coordinate system (NED) and finally the world coordinate system (GCS).


In this work, the application to reconstruct and visualize canals in 3D is developed in the C/C++ language. In order for the application to present 2D/3D graphical images, we employ the OpenGL library (www.opengl.org), which is free from licensing requirements. The graphical user interface for the end users to operate the application and adjust the visualization is implemented with the Qt library (qt-project.org) under open source license. This is how the application looks like.


Some experimental results:


The program is now completed but I haven't created its snapshop video yet. Here is the application at its 70%-completed status (27 May 2014).


Publications:
Tanathong, S., Rudahl, K.T., Goldin, S.E., 2014. 3D reconstruction of canal profiles using data acquired from teleoperated boat. In: Proceedings of Asia GIS, Chiang Mai, Thailand. [PDF]

Presentations:
GeoFest2014 Seminar, King Mongkut's University of Technology Thonburi [Powerpoint]

Object detection based on template matching through use of Best-So-Far ABC

Template matching is a technique in computer vision used for finding a sub-image of a target image which matches a template image.

The template matching technique requires extensive computational cost since the matching process involves moving the template image to all possible positions in a larger target image and computing a numerical index that indicates how well the template matches the image in that position. Therefore, this problem can be considered as an optimization problem. The algorithms based on swarm intelligence approach have been considered as a way to alleviate the drawback of the long processing time in this problem.

This study employs the best-so-far ABC (Banharnsakun, 2011) to improve the solution quality in detecting the target objects and to optimize the time used to reach the solution.

The software solution was developed in C/C++. Banharsakun, who proposed the Best-so-far ABC, took the major part in integrating the best-so-far ABC approach with the matching.

The detected object results from the best-so-far ABC with RGB histogram:


Publications:
1. Banharnsakun, A., Tanathong, S., 2014. Object detection based on template matching through use of Best-So-Far ABC. Computational Intelligence and Neuroscience, vol. 2014. [LINK]
2. Tanathong, S., Banharnsakun, A., 2014. Multiple Object Tracking Based on a Hierarchical Clustering of Features Approach. In Proceedings of ACIIDS, Bangkok, Thailand. [LINK]

Realtime Image Matching for Vision Based Car Navigation

In this project, I am responsible for the image matching part that will be integrated to the car navigation project. The image matching is implemented based on the Kanade-Lucas-Tomasi (KLT), which is well-known for its computational efficiency, and widely used for real-time applications.

Although KLT is a promising approach to the real-time acquisition of tie-points, extracting tie-points from urban traffic scenes captured from a moving camera is a challenging task. To be used as a source of inputs for the bundle adjustment process, tie-points must not be acquired from moving objects but only from stationary objects. When the camera (observer) is at a fixed position, moving objects can be distinguished from stationary objects by considering the direction and magnitude of optical flow vectors. However, when the camera moves, it also induces optical flows for stationary objects. This makes it difficult to separate them from moving objects. The problem is more complicated on road scenes which involve several moving objects. At this point, the problem of image matching is not only to produce tie-points but also to discard those associated with moving objects.

This study presents an image matching system based on the KLT algorithm. To simplify the aforementioned problem, the built-in sensory data are employed. The sensors offer translation velocity and angular velocity of the camera (in fact, the vehicle that boards the camera). These data can be used to derive the position and attitude parameters of the camera, which will be referred to as preliminary exterior orientation (EO).

We develop our image matching system based on the KLT algorithm. The procedure of the system is presented below. Typically, we perform tracking and output a set of tie-points every second. Since KLT only works when the displacement between frames is small, we thus perform tracking on a number of frames for each second but return a single set of tie-points to AT. In this work, basic outlier removal includes performing (1) cross correlation coefficient, (2) KLT tracking cross-check, and (3) optical flow evaluation, in respective order. For moving object removal, we use initial EOs to perform projection and identify moving objects based on the discrepancy between tracking points and projecting points.

The procedure of the proposed image matching for a car navigation system.


The image matching software is developed in C/C++ based on the OpenCV library (OpenCV 1.1).

The tie-point projection result is presented below:

Some of the image matching results are presented below:


Publication:
Choi, K., Tanathong, S., Kim, H., Lee, I., 2013. Realtime image matching for vision based car navigation with built-in sensory data. Proceedings of ISPRS Annuals of Photogrammetry, Remote Sensing and Spatial Information Sciences, Antalya, Turkey. [PDF]

Fast Image Matching for Real-time Georeferencing using Exterior Orientation Observed from GPS/INS

Advances in science and technology provide new capabilities to improve human security. One example is the area of disaster response, which has become far more effective due to the application of remote sensing and other computing technologies. However, traditional photogrammetric georeferencing techniques which rely on manual control point selection are too slow to meet the challenge as both the number and severity of disasters are increasing worldwide. To use imagery effectively for disaster response, we need so-called real-time georeferencing. That is, it must be possible to obtain accurate external orientation (EO) of photographs or images in real time.

In this study, we present a fast, automated image matching system based on the Kanade-Lucas-Tomasi (KLT) algorithm that, when operated in conjunction with a real-time aerial triangulation (AT), allows the EOs to be determined immediately after image acquisition.


Although KLT shows a promising ability to deliver tie-points to end applications in real time, the algorithm is vulnerable when the adjacent images undergo large displacement or are captured during a sharp turn of the acquisition platform (in our research, an Unmanned Aerial Vehicle or UAV). This can be illustrated as the figure below:


This study proposes to overcome these limitations by determining a good initial approximation for the KLT problem from the EOs observed through GPS/INS. This allows the algorithm to converge to the final solution more quickly.


Integrating the proposed approach into the pyramidal tracking model, the implementation procedure (derived based on the pyramidal implementation from Bouguet, 2000) can be presented as the figure below. The derivation in the figure is based on the translation model, Eq. (3.2).


The related equations are summarized below:


In this research, we also present a mathematical solution to determine the number of depth levels for the image pyramid, which has previously been defined manually by operational personnel. As a result, our system can function automatically without human intervention. For more clarification, please have a look at this document.


In addition, the research work reported here enhances the KLT feature detection to obtain a larger number of features, and introduces geometric constraints to improve the quality of tie-points. This leads to greater success in AT.

The proposed image matching system used for the experimental testing is developed in C/C++ using the Microsoft Visual Studio 2008 framework. The KLT algorithm adopted for this research study is implemented by modifying the OpenCV library version 1.1 (OpenCV, 2012). Most of the auxiliary functions used to deal with images are also based on the OpenCV library. The implementation of the image matching for real-time georeferencing can be illustrated as the figure below.


The goal of the experiment is to present the improvement in accuracy of the directly observed EOs (EOS1, EOS2 and EOS3) after being refined through a bundle adjustment process given tie-points produced by the proposed image matching. In addition, the experiment measures the accuracy of the adjusted EOs (EOA1, EOA2 and EOA3) when a larger number of tie-points is involved in the computation of AT. The accuracy of the initial EOs is listed in the tables below:


The experimental results demonstrate that the image matching system in conjunction with AT can refine the accuracy of all initial EOS1, EOS2 and EOS3. The adjusted EOs have a lower RMS of discrepancy against the true EOs when compared with that of the directly observed EOs. Moreover, the level of accuracy can be further improved by increasing the number of tie-points for AT. For example, the RMS of the initial EOS3 is measured as 2.122m, 1.670m and 1.725m for three position parameters and 1.780deg, 1.790deg and 2.079deg for three attitude parameters. The AT process (std_ip = 15) can improve the accuracy of position parameters by 25% and attitude parameters by 58%, when the maximum number of tie-points is defined as 3×3×3 per stereo image. Increasing the number of tie-points to 3×3×4, the accuracy of the adjusted EOA3 improves by 37% and 69% for position and attitude, when compared with the directly observed EOs. The improvements in accuracy for position and attitude parameters are up to 40% and 70% when the number of tie-points is defined as 3×3×5.The experimental results for this dataset are summarized in the figure below:


Publications:
1. Tanathong, S., Lee, I., 2014. Translation-based KLT tracker under severe camera rotation using GPS/INS data. IEEE Geoscience and Remote Sensing Letters, vol. 11, no. 1, pp. 64-68. [LINK][Sourcecode]
2. Tanathong, S., Lee, I., In Press. Using GPS/INS data to enhance image matching for real-time aerial triangulation. Computers & Geosciences. [LINK]
3. Tanathong, S., Lee, I., Submitted for publication. Accuracy assessment of the rotational invariant KLT tracker and its application to real-time georeferencing. Journal of Applied Remote Sensing. (Revision in progress)
4. Tanathong, S., Lee, I., 2011. A development of a fast and automated image matching based on KLT tracker for real-time image georeferencing. Proceedings of ISRS, Yeosu, Korea. (Student Paper Award)
5. Tanathong, S., Lee, I., 2011. An automated real-time image georeferencing system. Proceedings of IPCV, Las Vegas, USA.
6. Tanathong, S., Lee, I., 2010. Speeding up the KLT tracker for real-time image georeferencing using GPS/INS data. Korean Journal of Remote Sensing, vol. 26, no. 6, pp. 629-644.[LINK][PDF]
7. Tanathong, S., Lee, I., 2010. Towards improving the KLT tracker for real-time image georeferencing using GPS/INS data. Proceedings of 16th Korea-Japan Joint Workshop on Frontiers of Computer Vision, Hiroshima, Japan.
8. Tanathong, S., Lee, I., 2009. The improvement of KLT for real-time feature tracking from UAV image sequence. Proceedings of ACRS, Beijing, China.

Integrated Sensor Orientation Simulator

Aerial Triangulation (AT) has long been a solution to the determination of the Exterior Orientation (EO) of the camera, but it requires knowledge of ground control points which must still be established through ground surveying, which is both an expensive endeavor and impracticable for inaccessible areas or dangerous locations.

With the advancement of Micro-ElectroMechanical Systems (MEMS) and improvements in sensor technology, direct georeferencing have played an increasingly important role in many photogrammetric applications. The GPS/INS (Global Positioning System/Inertial Navigation System) enables real-time acquisition of imaging orientation parameters without post computational operations allowing to achieve considerable savings of both cost and time.

However, some researchers have shown the accuracy of direct georeferencing to be inferior to the results of conventional aerial triangulation . Another serious problem with direct georeferencing is that it results in large y-parallax in stereo models. Presently, the y-parallax problem may be addressed by implementing Integrated Sensor Orientation (ISO). ISO is another alternative approach to georeferencing that combines the advantages of direct georeferencing and aerial triangulation.

Since the inclusion of tie-points is a major contributing factor to the accuracy of ISO, the operators usually perform interactive post operations after automated tie-point selection to ensure the quality of tie-points. As, in this case, tie-points are nearly flawless, the operators may wonder how many tie-points are sufficient to refine the accuracy of the directly measured EOs, and how much the accuracy can be improved. Are the positions of tie-points significant and do the distribution of tie-points influence the adjustment result? The problem is more complicated when tie-points are subjected to contaminate with some outliers such as those tie-points produced for real-time applications, for example airborne multi-sensor rapid mapping systems or disaster monitoring systems. For said applications, tie-pionts must be produced in real-time and interactive quality check of tie-points is hardly possible. In this case, the accuracy of tie-points is still questionable. The question arises as to whether less accurate tie-points can still benefit the refinement of EOs. Can a large number of tie-points compensate for their less accuracy?

In an attempt to address the aforementioned problems, this work presents an implementation of an integrated sensor orientation simulator.


The below image presents a snapshot result of the simulator in generating the ground points and coverage for each image.

Publications:
1. Tanathong, S., Lee, I., 2014. Integrated sensor orientation simulator: design and implementation. European Journal of Remote Sensing, vol 47, pp 497 - 512. [Download paper]
2. Tanathong, S., Lee, I., 2012. A design framework for an integrated sensor orientation simulator. Proceedings of ISVC, Greece. [LINK]

Fiducial Mark Detector

A fundamental problem in photogrammetry is to determine the camera parameters. These camera parameters can be categorized into (1) interior orientation parameters, and (2) exterior orientation parameters. In this blog, I present an application to determine the interior orientation parameters.

The main interior orientation parameters (IO) or intrinsic camera parameters are (1) focal length and (2) principle point coordinates. The program I am presenting here is to find the fiducial marks in which we can further reveal the principle point positions.

For the implementation, the cross correlation coefficient is employed to search for the fiducial marks. This can be said as a template matching problem. The application screens are shown below:


The program is developed using the C/C++ language using MS Visual Studio .NET 2003. I have not used any library. The image processing is done in pixel-wise using the class CImage that comes with MFC.

This program is part of my assignment for the Digital Photogrammetry subject (2010, Summer).

[Sourcecode][Executable][Assignment Report]

The source code is now available on Github: https://github.com/stanathong/fiducial_mark_detector.

LiDAR Viewer in 2D Raster Format

The LiDAR Viewer project is part of my assignment for LiDAR class (2009 Winter).

The application reads XYZ or XYZC file (in which X,Y,Z is 3D coordinates and C is color) and visualize the results in the form of 2.5D image. It offers zoom and pan functionality.

The program was developed using MS Visual Studio .NET 2003 using the CImage class for presenting image.

The application screen is presented below.


[Sourcecode][Executable][Testdata,7MB]

The source code is now available on Github: https://github.com/stanathong/lidar_viewer.

Object Oriented Change Detection of Rectangular Buildings after the Indian Ocean Tsunami Disaster

The tsunami of December 26, 2004 was one of the worst disasters in human history. Following a disaster, change detection is a prerequisite for quick assessments of damage. To assess the severity of devastation, most damage assessments focus on the destruction of man-made objects, particularly buildings.

In this work, we develop a robust rectangular building detection that can detect both small-size buildings in residential areas and large-size buildings in industrial areas. We use both edge detection and region growing approaches to supplement each other. The discovered buildings then become the inputs to our change detection. We employ knowledge based intelligent agents to recognize buildings before and after a disaster. The figure below presents the overview of the system implementation.

The figure below discusses the rectangular building extraction procedure which is a two-step process: 1) Edge detection by Canny detector, 2) Region growing.

The picture below presents the building candidates.

Specifying classification rules into the object-based change detection system, the detected changes are presented below:

Publications:
1. Tanathong, S., Rudahl, K.T., Goldin, S.E., 2009. Object oriented change detection of buildings after a disaster. Proceedings of ASPRS, Baltimore, USA. [PDF]
2. Tanathong, S., Rudahl, K.T., Goldin, S.E., 2008. Object oriented change detection of buildings after the Indian Ocean tsunami disaster. Proceedings of ECTI-CON, Krabi, Thailand. [PDF][LINK]
3. Tanathong, S., Rudahl, K.T., Goldin, S.E., 2007. Object-based change detection: the tsunami disaster case. Proceedings of ACRS, Kuala Lumpur, Malaysia. [PDF]